Is Bitcoin Selling at a Discount?
Can historical price and on-chain data predict Bitcoin's future? Analyze sell pressure, HODL trends, and net realized profit/loss to assess if Bitcoin is at a discount or heading for correction.


Nobody can predict the future, however using historical price and on-chain data patterns, smart money investors can estimate the level of risks for buying Bitcoin at any market situation they are in. Recently, on-chain data reveal patterns that would concurrently appear before prices reach their local minimum.
So, the question is — is Bitcoin heading for a correction? Or is it selling at a discount? Let’s look at the data in this article.
Disclaimer: The data presented, and its interpretation are based on the most available data and knowledge at hand by the writer at the time of writing. The opinions presented in this article should not be interpreted as financial or trading advice.
Sell pressure is dropping off
Using on-chain analysis, it’s possible to know the price at which all Bitcoins have last exchanged hands. For example, if someone sent some BTC to their wallet when it was priced at US$20,000 (and that the coins have never moved since then), those coins are in profit at the current price of US$ 69,000.

Two weeks prior, it was trading at $70,000 and 96% of coins are in profit, which historically has been an indicator that selling pressure was imminent. Then over one week, prices dropped nearly 10%, and this meant that investors who were buying at $70,000 are now at a loss. Now, only around 86% of coins are in profit.
This could mean that selling pressure is easing off, and that long-term investors are catching the falling prices, accumulating more Bitcoin at what appears to be a discount.
Long term HODLers are accumulating coins
The “HODL wave” is a very popular chart that shows the distribution of coins by how long they’ve been in a wallet for. What’s important to pay attention here is how the distributions of longer term coins change.
For example, look for times when the cooler colours in the chart below shrink dramatically, and look for when the warmer colours begin dominating the scene of a specific period, such as in the year 2016 and late 2017.
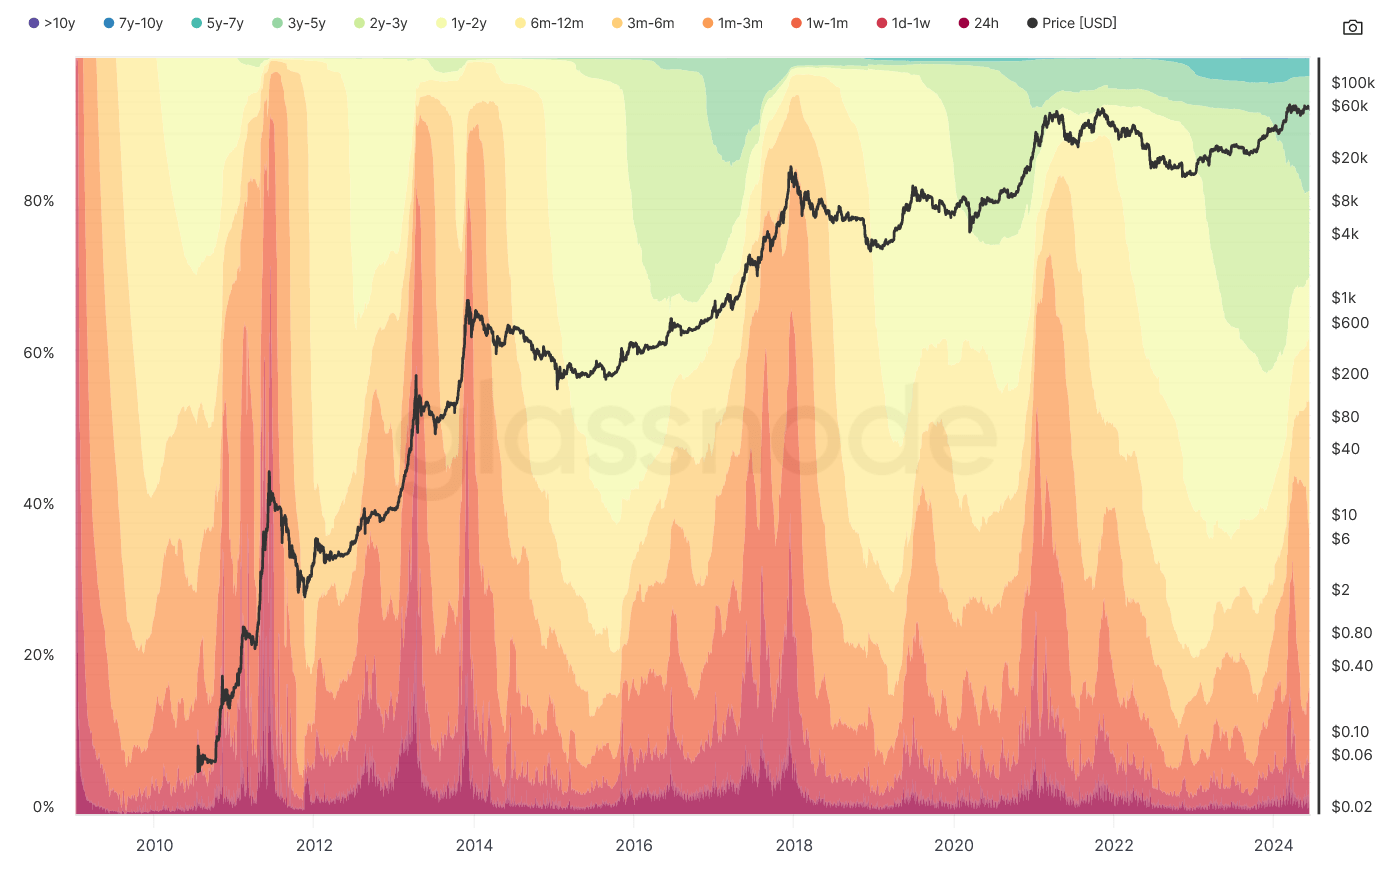
In the case of the year 2024, we are beginning to see the light green area receding. This is when coins that have been held for 2-3 years are now being moved (read: sold) to short-term traders. Historically, this marked the beginning of a bull run.
Net realised profit/loss nears equilibrium
On a particular day, we can measure how many coins were sold at a profit or at a loss. In a bull market, more coins tend to be sold at a profit, whilst the opposite is true.
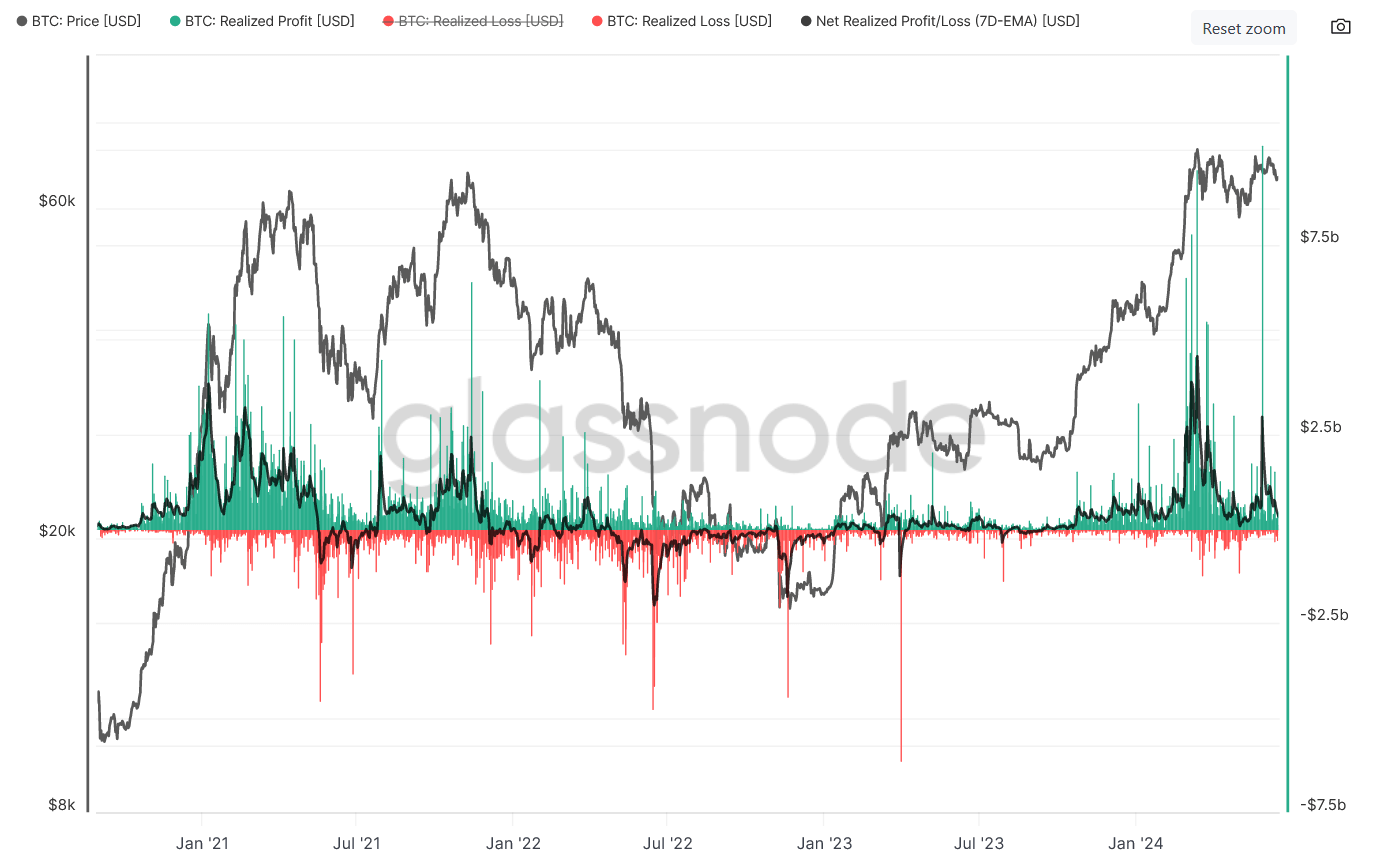
However, an interesting point to see is what happens in periods when the coins sold in profit and loss ‘cancel out’, meaning that the net realised profit/loss is at near zero, such as what we are seeing recently.
The following may explain this phenomenon. When the net realised profit/loss is near equilibrium especially when the price is volatile or dropping, coins in profit or loss are not being sold as much (stronger HODL behaviour).
If prices are dropping, but more investors appear to suffer realised losses, then it’s an indication that HODL behaviour is not strong enough to overcome market panic.
When strong HODLing behaviour is apparent, there’s a high chance that investors are anticipating higher prices where they could sell at a more considerable profit.
The takeaways
Based on these three charts alone, it appears that Bitcoin is selling at a discount (at the time of writing). However, there is also a possible scenario where the price could drop further.
At this point in time, the price of Bitcoin is ranging between 56k and 70k USD, with varying degrees of weekly volatility.
Further reading: Explore and learn all things crypto.
Share to
Stay curious and informed
Your info will be handled according to our Privacy Policy.
Table of Contents
We make it easy.
Start your crypto journey today!
Make sure to follow our Twitter, Instagram, and YouTube channel to stay up-to-date with Easy Crypto!
Also, don’t forget to subscribe to our monthly newsletter to have the latest crypto insights, news, and updates delivered to our inbox.
Disclaimer: Information is current as at the date of publication. This is general information only and is not intended to be advice. Crypto is volatile, carries risk and the value can go up and down. Past performance is not an indicator of future returns. Please do your own research.
Last updated June 27, 2024